
Belysa® Immunoassay Curve Fitting Software
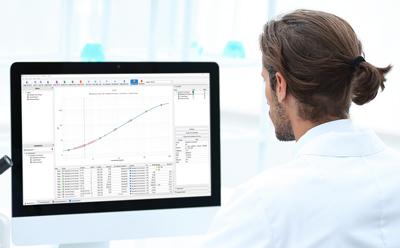
Belysa® Immunoassay Curve Fitting Software
Whether it’s Luminex® multiplex assays, SMC® kits, or ELISAs, Belysa® Immunoassay Curve Fitting Software is designed to give you confidence in your data. Our Belysa® analysis software provides curve fitting capabilities with .csv output files from the Luminex® xMAP® platforms like the xMAP® INTELLIFLEX®, Luminex® 200™, FLEXMAP 3D®, and MAGPIX® instruments as well as the SMCxPRO® and FemtoQuest® ultrasensitive systems.
Designed using current methods and principles, easy-to-use Belysa® software provides an environment to fit data appropriately based on individual standard curves within a multiplexed immunoassay, indicators of data hygiene to enhance experimental integrity and reproducibility, and a user-friendly tool for data evaluation before using it to model a biological outcome.
- Easily visualize standard curves
- Quickly compare standard curves between run-to-run and lot-to-lot
- Belysa® Analysis Software version 1.5 key features
- System requirements
Subscribe to analyte update and analyte quarterly
Stay up to date on the latest immunoassay research trends and our newest product offerings by subscribing to our Analyte Update newsletter or explore our current immunoassay offerings in the Analyte Quarterly.
Learn more about Belysa® Immunoassay Curve Fitting Software
Fields indicated by an * are required.
Easily visualize standard curves
The Belysa® analysis software displays single and multiplex data that allows the user to immediately visualize their standard curve and the distribution of standard points, controls, and samples. Further information, derived from the curve, is provided along with the option to refit the curves through the Belysa® software algorithms. Changes to interpolated data are instantly re-calculated following optimization (e.g. the slope equation, Upper & Lower Limits of Quantification (ULOQ & LLOQ), or reported sample values).
Additionally, the detailed view within the software allows the parameters of the assay well to be observed. Two sets of identifiers allow users to draw attention to a potential deviation, a warning for software-defined rules, such as Non-Detectable (ND) samples, or user-defined parameters (e.g. % Recovery).

Figure 1.Easily visualize standard curves with Belysa® software. Example standard curve for IL-6 in Cat. No. HSTCMAG-28SK.
Quickly compare standard curves between run-to-run and lot-to-lot
For researchers looking to compare two or more standard curves, Belysa® software provides the option to test the mathematical parallelism between different runs of the same assay. The assumption being that if the curves are similar, then the method was consistent and the samples would report similarly if included on the other assay. A second metric of Relative Potency is also provided for those who wish to examine the consistency of a test material compared to a standard version.
Furthermore, Belysa® software offers the option to visualize parallel curves with multiplex data and allows the user to quickly see the relationship between the curves. The calculated value for this feature is conveniently presented in the lower window and reportable, both graphically and numerically, in an output file.
Taken together, these features provided by the Belysa® software aid researchers in their ability to examine each individual assay and confirm that it was successfully executed. If the assay is performed as part of a multi-plate or longitudinal study, our Belysa® software allows you to confirm the consistency of your method and that the data generated is free from experimental deviation which may affect your end results.

Figure 2.Effortlessly test parallelism and standard curves with the Belysa® data analysis tools. Example Belysa® .csv output file for parallelism of three lots of TNF-α Conferma® ELISA, Cat. No. EZHTNFA-150K.
Belysa® Analysis Software version 1.5 key features
- Curve fit optimization (4pl, 5pl, Linear, Competitive, Cubic Spline)
- Curve statistics displayed and reported (e.g. LLOQ, ULOQ, LOD, Slope, Equation etc.)
- Single and multi-analyte views
- Robust, modifiable auto-flagging and data hygiene features
- Relative potency analysis for multiple compare curves
- Simple interface
- Flexible license mechanism. Activation dongle opens any copy.
System requirements
- PC with:
o Microsoft Windows 10 or higher
o macOS - A free USB port on the USB
- A Belysa® license activation dongle
Explore the unique ways to look closer at the data you generate with pre-recorded webinars, application notes, technical articles, and more.