


Research Area - Oncology |
Request Information |
Featured Spotlights
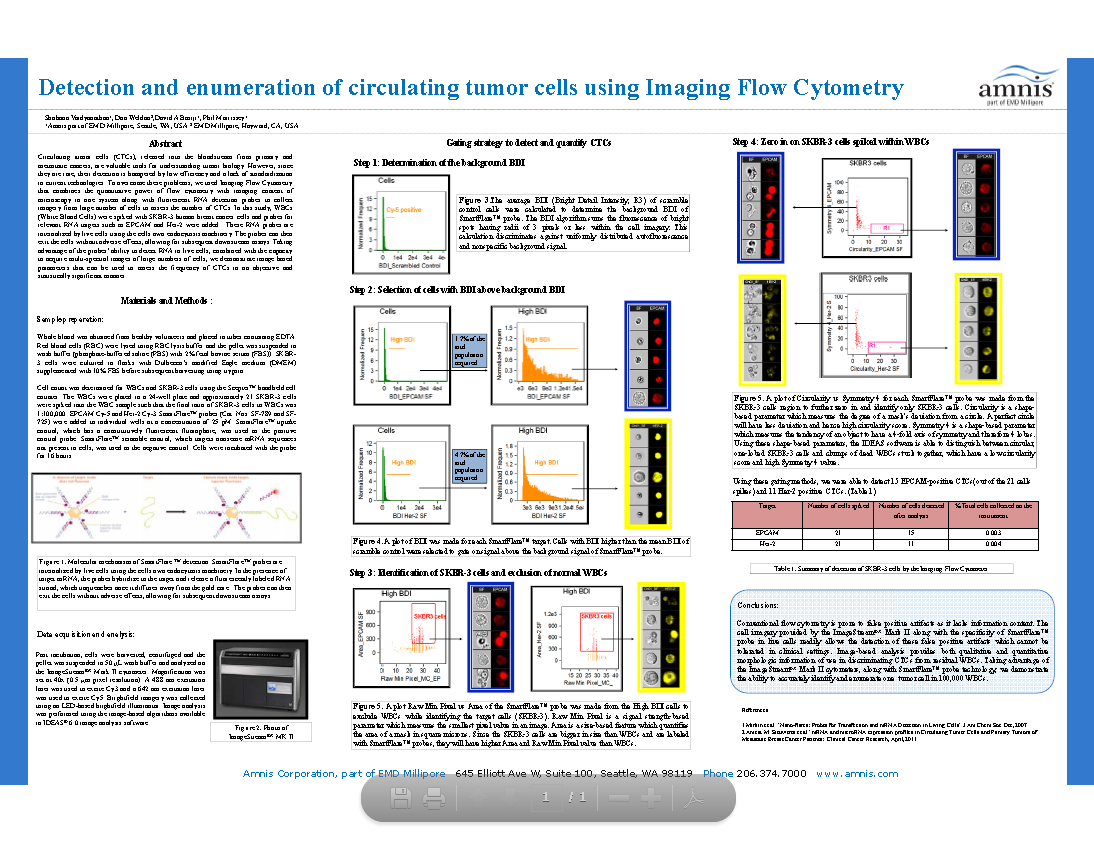
| Poster: Detection and enumeration of circulating tumor cells using imaging flow cytometry |
Technical Information: Assessing Autophagy with the FlowSight® Imaging Flow Cytometer |
|
|
|
|
|
|
 The field of Oncology is largely concerned with elucidating how cancers develop and how best to develop therapies to treat them. Oncologists commonly employ microscopy not only to identify and classify cancer cells, but also to identify the fragmented nuclei of apoptotic cells treated with a chemotherapeutic drug, or to visualize the binding and subsequent internalization and trafficking of therapeutic monoclonal antibodies. Amnis® imaging flow cytometry is ideally suited to these types of studies, and gives the added benefit of combining immunophenotyping with quantitative morphometric measurements that can be applied to identifying rare sub-populations of potentially metastatic cells, including circulating tumor cells (CTC).
- Co-Localization of an Antibody-Drug Conjugate to Endosomes or Lysosomes
- Apoptotic Index Using the ImageStream
Co-Localization of an Antibody-Drug Conjugate to Endosomes or Lysosomes

Apoptotic Index Using the ImageStream
