
GC-MS/MS determination of pesticides and their metabolites in drinking water
Abstract
A method for the simultaneous determination of 42 organophosphorus pesticides and metabolites in drinking water was established using gas chromatography-tandem mass spectrometry (GC-MS/MS). Drinking water samples were pretreated by solid-phase extraction (SPE), and the analytes were determined in dynamic multiple reaction monitoring (MRM) mode using external calibration with solvent-based standards prepared in ethyl acetate. Linear responses were obtained over the calibration range of 10 to 500 µg/L (final extract; equivalent to 10 to 500 ng/L in the water sample), with correlation coefficients (R²) greater than 0.9980. Recoveries in spiked drinking water samples ranged from 67.9% to 110%, and relative standard deviations (RSDs) ranged from 1.30% to 9.20%. The estimated limits of quantification (LOQs), expressed as concentrations in the final 1 mL extract obtained from a 1 L water sample (1000-fold enrichment), were below 10 µg/L (corresponding to below 10 ng/L in the water sample, assuming complete recovery). The method met the assessed linearity, recovery, and precision requirements of GB/T 5750.9-2023 and is suitable for the determination of the 42 target compounds in drinking water.
Section Overview
Introduction
Pesticide residues in drinking water may arise from agricultural activities and other sources of environmental contamination. Reliable analytical methods are therefore required to monitor these residues and assess drinking water quality. Pesticide residues in drinking water can be analyzed by gas chromatography-tandem mass spectrometry (GC-MS/MS) and liquid chromatography-tandem mass spectrometry (LC-MS/MS).¹˒²
To support consistent monitoring, China's National Standard for Drinking Water Examination, GB/T 5750.9-2023, specifies methods for pesticide analysis in drinking water. The updated standard identifies 42 organophosphorus pesticide compounds as target substances for drinking water testing.³˒⁴
In this study, these 42 organophosphorus pesticide compounds, including parent pesticides and their transformation products, were analyzed in drinking water according to the applicable procedure described in GB/T 5750.9-2023. Quantification was performed by external calibration using solvent-based standards prepared in ethyl acetate and injected without SPE (see Experimental section).
Experimental
Reagent preparation
- Hydrochloric acid solution (6 M): A 50 mL aliquot of 37% hydrochloric acid was slowly added to a minimum quantity of water in a suitable heat-resistant vessel. The solution was allowed to cool to room temperature and quantitatively transferred to a 100 mL volumetric flask. The original vessel was rinsed with water, and the rinses were transferred to the flask. The solution was diluted to the mark with water and mixed thoroughly. Caution: Dilution of concentrated acids is highly exothermic. Always add acid to water.
Standard preparation
- Pesticide stock solution I (10.0 µg/mL): A 1 mL aliquot of the mixed standard solution containing 42 pesticides and their metabolites (100 µg/mL of each analyte) was transferred to a 10 mL amber glass volumetric flask and diluted to the mark with ethyl acetate. The resulting solution contained 10.0 µg/mL of each analyte and was stored at 0 to 4 °C, protected from light. (Note: The mixed standard solution of the 42 organophosphorus pesticides and metabolites (1.2 mL, 100 µg/mL of each analyte) was purchased as a ready-made mixture from Alta Technology Co., Ltd.)
- Pesticide stock solution II (1 µg/mL): A 1 mL aliquot of stock solution I was transferred to a 10 mL amber glass volumetric flask and diluted to the mark with ethyl acetate. The resulting solution contained 1.0 µg/mL of each analyte and was stored at 0 to 4 °C, protected from light.
- Pesticide standard solutions 1-5: Aliquots of 10, 50, 100, 300, and 500 µL of stock solution II were transferred into separate 1 mL volumetric flasks. Each solution was diluted to the final volume with ethyl acetate to obtain concentrations of 10.0, 50.0, 100, 300, and 500 µg/L, respectively, for each analyte. These solvent-based standards were injected directly into the GC-MS/MS system without SPE and used for external calibration. The calibration concentrations correspond to concentrations in the final 1 mL sample extract. Assuming 100% SPE recovery, they are equivalent to concentrations of 10–500 ng/L, respectively, in the original 1 L water sample following the 1000-fold concentration step.
Calibration approach: External calibration with solvent-based standards (pesticide standard solutions 1-5 in ethyl acetate) was used; no matrix-matched calibration standards were prepared. Recoveries from the spiked water samples (see below) were therefore calculated against the solvent-based calibration and reflect both SPE recovery and any matrix effects.
Sample collection and preparation
Sample collection
A bulk drinking-water sample (14 L in total) was collected from a local tap in amber glass bottles. Ascorbic acid (100 mg/L) was added to the sample to quench residual chlorine, and the sample was mixed thoroughly. The bottle was sealed, and the sample was stored at 0 to 4 °C, protected from light, and analyzed within 48 h (2 days) of collection. All aliquots used in this study (the 1 L unspiked aliquot and the 1 L spiked aliquots described below) were taken from this same bulk sample after the ascorbic acid addition and were stored under identical conditions (0 to 4 °C, protected from light) until further processing.
Unspiked water sample preparation
SPE extraction
- SPE tube conditioning: A Supelclean™ ENVI™-18 SPE tube (1 g/6 mL, 505706) was rinsed with 5 mL of dichloromethane, followed by 5 mL of ethyl acetate. A vacuum was applied for 1 min to dry the sorbent bed. The tube was then equilibrated by passing 10 mL of methanol followed by 10 mL of ultrapure water through the tube.
- Sample loading: A 1 L aliquot of the water sample was passed through the SPE tube at a flow rate of 15 mL/min.
- Drying: The SPE tube was dried completely under vacuum.
- Elution: The analytes were eluted with 3 mL of ethyl acetate followed by 3 mL of dichloromethane. The eluate was collected.
- Concentration and reconstitution: The eluate (6 mL) was evaporated completely to dryness under a stream of nitrogen. The residue was reconstituted in ethyl acetate, and the volume was adjusted to exactly 1 mL with ethyl acetate in a calibrated volumetric vessel. The resulting solution was used for GC-MS/MS analysis.
Spiked sample solution preparation
For the evaluation of method recovery and precision, two 1 L aliquots of the same bulk drinking-water sample (preserved and stored as described under sample collection) were spiked with 50 and 100 µL of pesticide stock solution II (1.0 µg/mL of each analyte), respectively. The resulting concentrations of each pesticide and metabolite in the original water samples, before SPE extraction and concentration, were 50 and 100 ng/L, respectively. The 50 ng/L spiked sample was used for precision evaluation, and the 100 ng/L spiked sample was used for recovery evaluation. The spiking solutions were added before SPE, and the spiked samples were then subjected to the same SPE, evaporation and reconstitution procedure (final volume 1 mL) as the unspiked sample. Assuming 100% recovery, concentration of each 1 L sample to a final volume of 1 mL would yield theoretical analyte concentrations of 50 and 100 µg/L, respectively, in the final extracts. n = 7 (50 ng/L) and n = 6 (100 ng/L) are independent 1 L spiked samples, each processed by SPE separately.
GC-MS/MS analysis
The samples were analyzed by GC-MS/MS using a low-polarity SLB®-5ms capillary column. The GC conditions are listed in Table 1, and the MS conditions are provided in Table 2.
Results and discussion
Drinking water samples treated with ascorbic acid (100 mg/L) to remove residual chlorine were pretreated with hydrochloric acid solution (6 M), extracted by solid-phase extraction (SPE), and analyzed by gas chromatography-tandem mass spectrometry (GC-MS/MS). The quantification of all 42 organophosphorus pesticides and metabolites was performed using an external calibration with solvent-based standards (pesticide standard solutions 1-5 in ethyl acetate).
Figure 1 shows the GC-MS/MS chromatogram of the unspiked drinking water sample following SPE extraction and concentration (1 L to 1 mL). No peaks distinguishable from the baseline noise were observed at the retention times of the 42 target pesticides and metabolites (Table 3), indicating that none of the target compounds was detected in the unspiked sample under the applied analytical conditions. The unspiked sample was therefore also used as the blank matrix for the spiking experiments. Figures 2 and 3 show the GC-MS/MS chromatogram of pesticide standard solution 2 (50 µg/L of each analyte in ethyl acetate) and drinking water sample spiked with the target pesticides and metabolites at 50 ng/L before SPE, respectively.
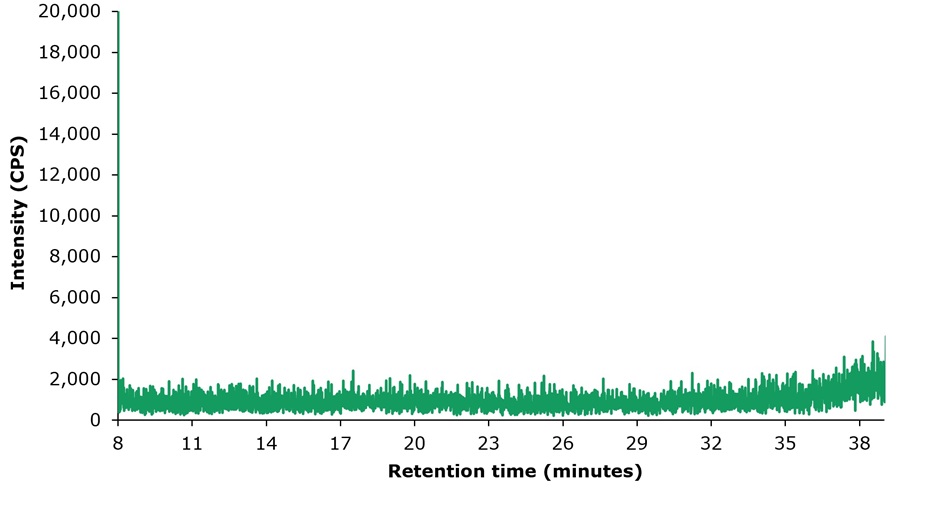
Figure 1.GC-MS/MS chromatogram of an unspiked drinking water sample.
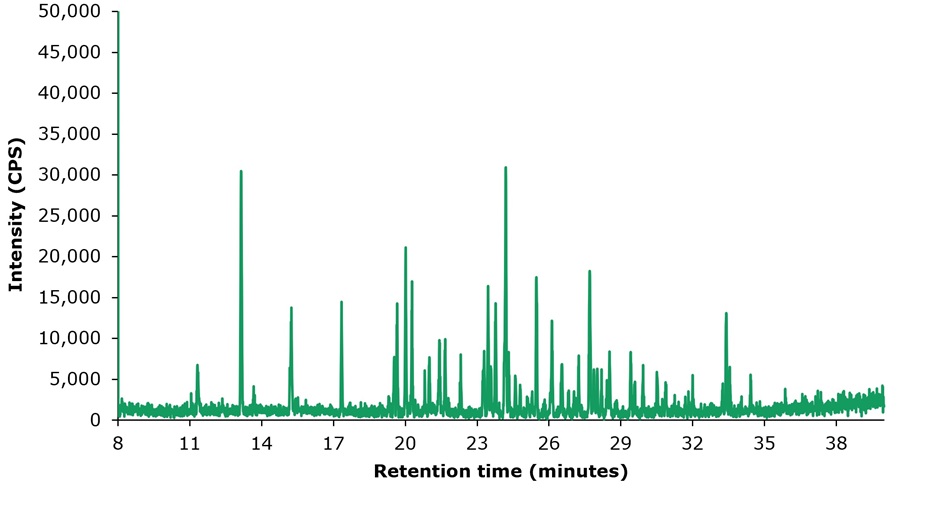
Figure 2.GC-MS/MS chromatogram of pesticide standard solution 2 containing 42 target pesticides and metabolites at 50 µg/L each in ethyl acetate.
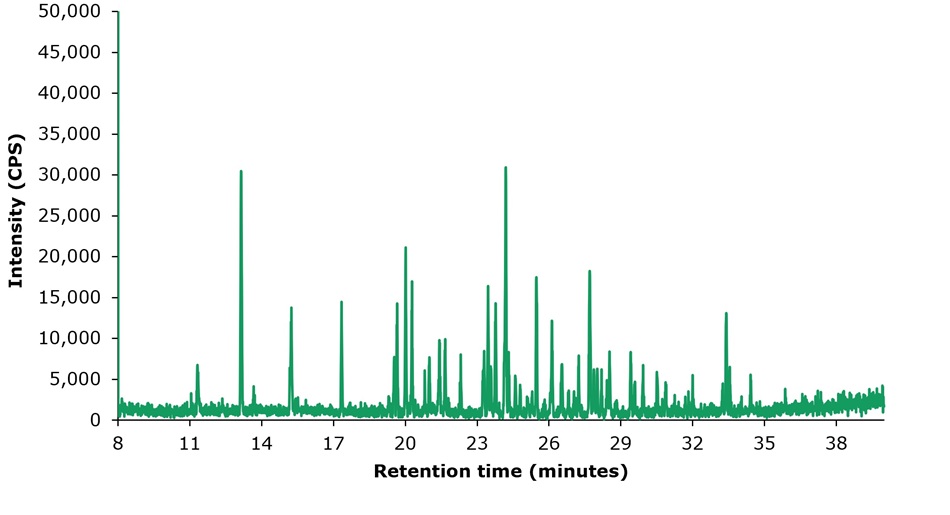
Figure 3.GC-MS/MS chromatogram of a drinking water sample spiked with all 42 target pesticides and metabolites at 50 ng/L and processed by SPE. The theoretical concentration of each analyte in the final extract was 50 µg/L, assuming 100% recovery.
Table 3. Chromatographic data and MRM transitions obtained for water sample spiked at 50 ng/L per analyte
Calibration
External calibration curves were constructed from pesticide standard solutions 1-5 (10.0, 50.0, 100, 300, and 500 µg/L of each analyte in ethyl acetate), which were injected directly without SPE. These concentrations refer to the final extract (1 mL) and correspond to 10-500 ng/L in the original 1 L water sample (1000-fold concentration, complete recovery assumed). The correlation coefficients R2 ranged from 0.9982 to 0.9999, meeting the GB method’s requirement of >0.9950 specified in GB/T 5750.9-2023. The calibration data for all 42 pesticides and metabolites are presented in Table 4. The estimated limits of quantification (LOQs) of all analytes, expressed as concentrations in the final extract, ranged from 7.49 to 9.91 µg/L (Table 5) and were thus below the lowest calibration level (10 µg/L). As no calibration standard was analyzed below 10 µg/L, linearity is demonstrated from 10 µg/L in the extract (10 ng/L in the water sample); LOQ values below this level are indicative and are given for comparison with the GB requirement of <10 µg/L.
Table 4. Calibration data for all 42 pesticides obtained by the analysis of pesticides standard solutions 1-5
Data precision and recovery (%)
Precision was evaluated using the drinking water sample spiked at 50 ng/L (n = 7; Table 5, Figure 5). The relative standard deviations (%RSD) for the 42 pesticides and metabolites ranged from 1.30% to 9.20%, meeting the acceptance criterion of less than 15% specified in GB/T 5750.9-2023.
Recovery was evaluated using the drinking water sample spiked at 100 ng/L. Recoveries ranged from 67.9% to 110% (Table 5, Figure 4), meeting the acceptance criteria of 60% to 120% specified in GB/T 5750.9-2023. Mevinphos, sulfotep, demeton O&S, and phorate sulfoxide showed recoveries below 70%. Because quantification was based on solvent standards, the recoveries reflect both SPE recovery and any matrix effects.
The LOQs in Table 5 refer to the GC-MS/MS analysis of the final extract (1 mL) obtained from 1 L of water sample. The 1,000-fold concentration factor (1 L to 1 mL) corresponds to LOQs below 10 ng/L in the original water sample, assuming complete recovery; the water-sample values are higher by a factor of 1/recovery (up to 1.5 for the lowest observed recovery of 67.9%).
Table 5. Sensitivity, precision, and recovery results for 42 pesticides and metabolites
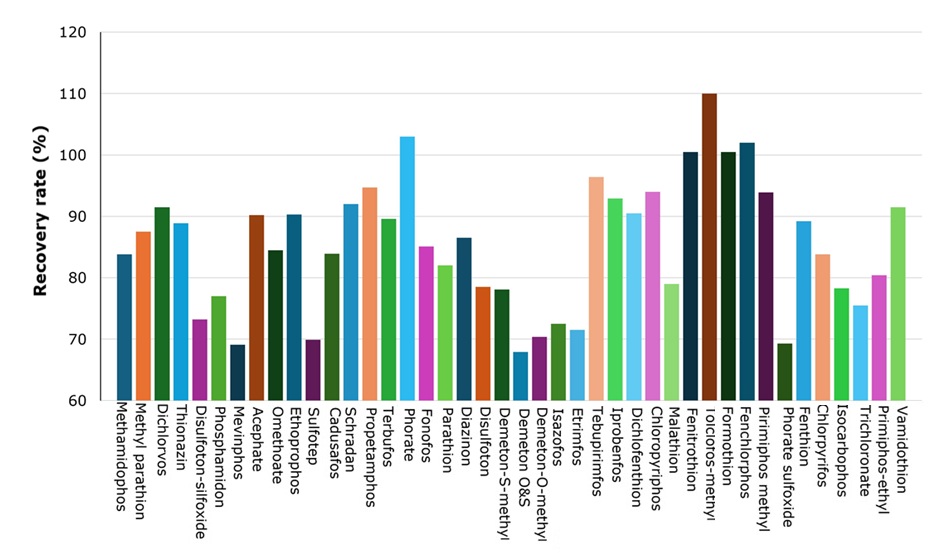
Figure 4.Recovery rates (%) of the 42 target pesticides and metabolites in spiked drinking water samples.
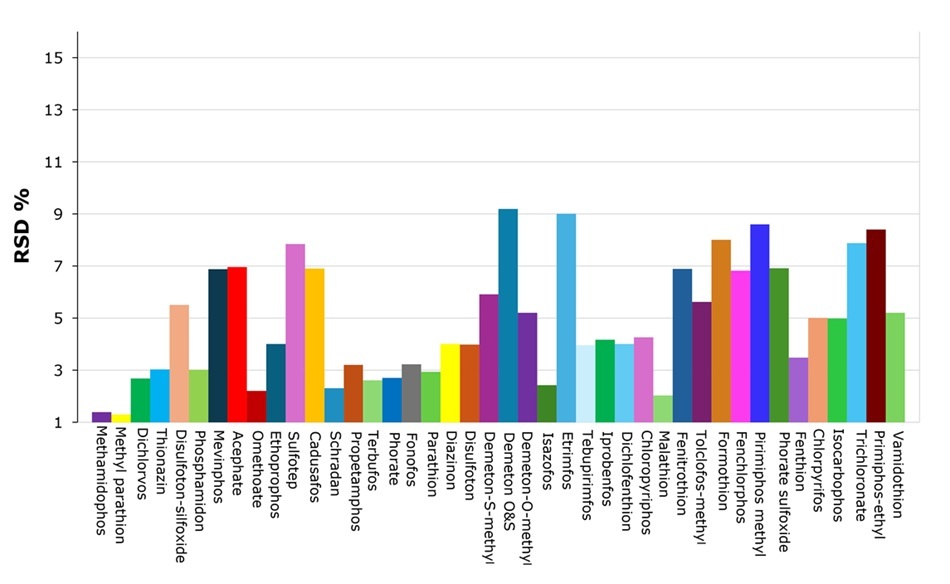
Figure 5.Relative standard deviations (%RSD) for the analysis of 42 pesticides and metabolites in drinking water samples.
Suitability criteria summary
Table 6 summarizes the acceptance criteria specified in GB/T 5750.9-2023 and demonstrates that the experimental results obtained with the developed method met the requirements of the standard.
Conclusion
A method for the analysis of 42 organophosphorus pesticides and metabolites in drinking water was evaluated according to GB/T 5750.9-2023, using solid-phase extraction (SPE) for sample preparation and gas chromatography-tandem mass spectrometry (GC-MS/MS) for analysis. All target compounds showed linear responses over the calibration range of 10 to 500 µg/L, with correlation coefficients (R²) greater than 0.9980, exceeding the minimum requirement of 0.9950 specified in the standard. Recoveries ranged from 67.9% to 110%, and relative standard deviations (RSDs) ranged from 1.30% to 9.20%. The estimated limits of quantification (LOQs), expressed as concentrations in the final 1 mL extract of a 1 L water sample, were below 10 µg/L (below 10 ng/L in the water sample, assuming complete recovery). The results met the assessed linearity, recovery, and precision acceptance criteria specified in GB/T 5750.9-2023.
Overall, the results demonstrate the suitability of the evaluated SPE and GC-MS/MS procedure for the analysis of the 42 target compounds in drinking water.