Assessing 2.5D Cell Culture Health Using MILLIPLEX® Cell Health Panel
Performing Cell Culture on Inserts
2.5D cell culture often involves growing the cells on physical scaffolds like cell culture inserts; this environment encourages structures that are associated with 3D cultures to grow, enhancing attachment and differentiation. Millicell® hanging cell culture inserts with polyethylene terephthalate (PET) membrane are ideal for the growth and differentiation of various cell monolayers in 2.5D culture. These microporous membranes allow cells to access media and nutrients from both the apical and basolateral sides of the membrane, increasing the biological relevance of the cultures.
Our 0.4 µm (pore size) membrane Millicell® inserts are available in two pore densities: 4x10⁶ pores/cm2 and 100x106 pores/cm2. The lower pore density membrane is optically clear, while the high pore density membrane is optically translucent. The optically clear membrane in the Millicell® cell culture inserts allows fluorescent and phase imaging of MDCK II cells directly from the cell culture plate. This bypasses the need to excise the membrane from the housing, optimizing the workflow.
Using the MDCK II and Caco-2 cell lines, here we compare the imaging quality of high and low pore density 0.4 µm membranes, verifying monolayer formation with Lucifer Yellow passthrough assay and assessing cell health using a MILLIPLEX® Human Cell Health Panel.
Section Overview
Materials for Assessing Cell Health on Millicell® Inserts
- Millicell® 24-well inserts with clear 0.4 µm PET membrane (Prod. No. PCTH24H48)
- Millicell® 24-well inserts with translucent 0.4 µm PET membrane (Prod. No. PTHT24H48)
- DMEM High Glucose (Prod. No. D5796)
- 10% FBS (Prod. No. F2442)
- 2 mM glutamine (Prod. No. G7513)
- 1x NEAA (Prod. No. M7145)
- 1x pen/strep (Prod. No. P4333)
- Lucifer yellow dye (100 µg/mL, Prod. No. L0144)
- 1x DAPI (Prod. No. DUO82062)
- 1x Anti-Fade (Prod. No. DUO82063)
- 1 mM sodium orthovanadate, and Proteinase-Phosphatase Inhibitor (Prod. No. 535140)
- MILLIPLEX® Human Cell Health Panel (Prod. No. 48-691MAG)
Methods for Assessing Cell Health on Millicell® Inserts
MDCK II and Caco-2 cells were cultured until 60-80% confluent and then seeded onto Millicell® cell culture inserts following the procedure in Cellular Fluorescence Imaging with Millicell® Cell Culture Inserts.
Lucifer Yellow passthrough assay was performed following the procedure in Barrier Formation and Permeability Assays using Millicell® Hanging Cell Culture Inserts.
Cell viability was assessed by ATP content measurement for MDCK II cells after 7 days in culture and Caco-2 cells after 24 days in culture.
Nuclear staining was performed following the procedure in Cellular Fluorescence Imaging with Millicell® Cell Culture Inserts.
MILLIPLEX® Cell Health Panel
The MILLIPLEX® Human Cell Health Panel (Prod. No. 48-691MAG) is a fixed 16-plex assay designed to simultaneously analyze key biomarkers related to oxidative stress, cell proliferation, DNA damage, and other critical cellular functions. This panel provides a comprehensive overview of overall cell health using cell lysate samples.
- Make lysis buffer with Cell Signaling Lysis Buffer, 1 mM sodium orthovanadate, and Proteinase-Phosphatase Inhibitor (Prod. No. 535140) immediately before use.
- Transfer inserts to a fresh 24 well plate without media on the basolateral side of the insert.
- Cells were washed with ice cold dPBS after 7 and 24 days in culture for MDCK II and Caco-2 cells, respectively.
- Add 30 µL of complete lysis buffer to each insert and gently scrape the membrane with a pipette tip or small cell scraper taking care to not puncture the membrane. Gently rock for 15-20 min at 4°C.
- Collect each cell lysate in a small centrifuge tube and dilute with 45 µL of Cell Signaling Assay Buffer 2.
- To prepare the MILLIPLEX® assay, dilute the 20x pre-mixed beads in Cell Signaling Assay Buffer 2.
- Add 25 µL of beads and 25 µL of lysate to each well in duplicate then incubate overnight at 4°C shaking (700 rpm).
- On day 2, wash the assay plate 2x using either a magnetic hand washer or an automatic plate washer.
- Dilute Detection Antibodies 20x and Blocker Mix 25x in Cell Signaling Assay Buffer 2 then add 25 µL per well.
- Incubate at room temperature for 1 hr shaking (700 rpm).
- Decant detection antibodies from plate while plate on magnet.
- Dilute Streptavidin-Phycoerythrin 25x in Cell Signaling Assay Buffer 2 and add 25 µL of SAPE per well.
- Shake (700 rpm) for 15 min at room temperature.
- Add 25 µL of Cell Signaling Amplification Buffer per well for 15 min shaking (700 rpm).
- Decant SAPE-Amplification Buffer from plate while plate on magnet.
- Add 100 µL of Sheath Fluid, shake for 5 min room temperature.
- Read on Luminex® instrument (50 µL, 50 beads per bead set settings).

Figure 1.Barrier Formation of MDCK II cells after 3, 5, and 7 days in culture on either clear or translucent Millicell® 0.4 µm inserts at three different seeding densities (625, 2500, and 5000 cells/well). Less than 5% passthrough is considered good barrier formation. MDCK II cells were able to form a barrier after 5 days with 5000 cells/well seeded and after 7 days for all three seeding densities. Translucent inserts had improved percentage passthrough after 5 and 7 days, however more passthrough was observed when compared to the clear Millicell® inserts.

Figure 2.Barrier Formation of Caco-2 cells after 18, 21, and 24 days in culture on either clear or translucent hanging well inserts at three different seeding densities (625, 2500, and 5000 cells/well). Less than 5% passthrough is considered good barrier formation. Caco-2 cells were able to form a barrier after 18 days with 2500 and 5000 cells/well seeded and after 24 days for all three seeding densities. Translucent hanging well inserts had improved percent passthrough after 21 and 24 days, however, more passthrough was observed compared to the clear Millicell® inserts.

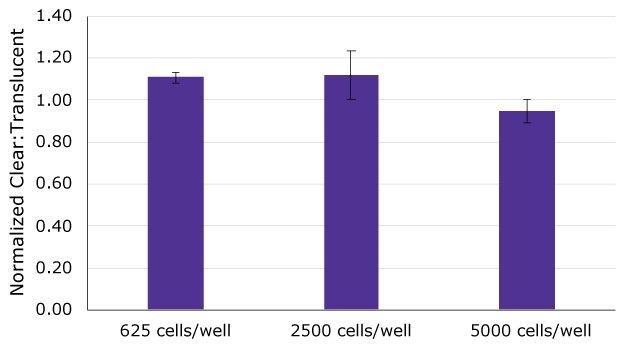
Figure 3.Cell viability, assessed by ATP quantitation, was compared between MDCK II cells culture on clear and translucent Millicell® inserts after 7 days in culture at 3 different seeding densities (625, 2500, and 5000 cells/well). ATP content of MDCK II cells cultured on clear Millicell® inserts was normalized to cells cultured on translucent Millicell® inserts. There was no significant difference in cell viability between clear and translucent Millicell® cultured cells at any density as values fell between +12%/-5% of completely equal (Clear/Translucent = 100%).

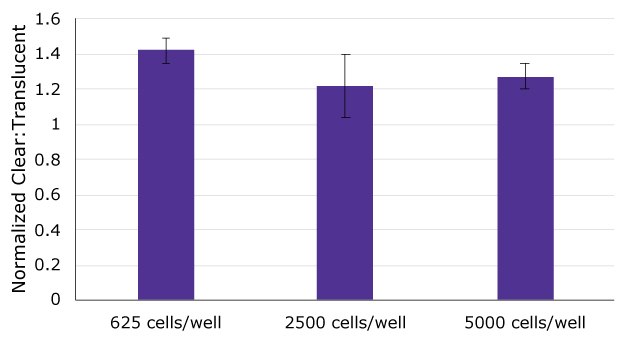
Figure 4.Cell viability, assessed by ATP quantitation, was compared between Caco-2 cells cultured on clear and translucent hanging wells inserts after 24 days in culture at 3 different seeding densities (625, 2500, and 5000 cells/well). ATP content of Caco-2 cells cultured on clear Millicell® inserts was normalized to cells cultured on translucent Millicell® inserts. Cell viability was approximately 20-40% higher in cells cultured on clear Millicell® inserts compared to translucent inserts and there was no difference between different initial seeding densities.

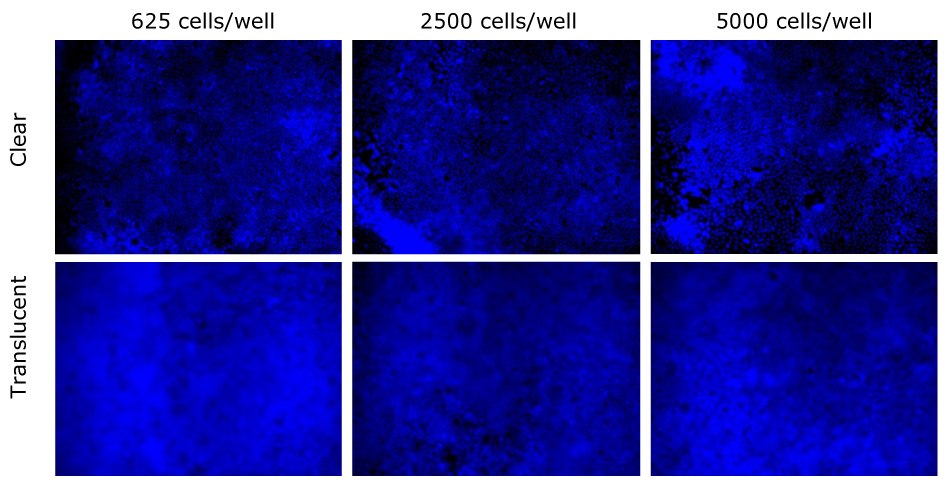
Figure 5.MDCK II nuclei were stained with DAPI after 7 days compared between clear and translucent Millicell® membranes. Nuclei were more clearly visible on clear Millicell® inserts than translucent. Scale bar = 50 µm.

Figure 6.MDCK II nuclei were stained with Caco-2 after 24 days compared between clear and translucent Millicell® membranes. Nuclei were more clearly visible on clear Millicell® inserts than translucent. Scale bar = 100 µm.

Figure 7.Median Fluorescence Intensity (MFI) readings using the MILLIPLEX® Cell Health Panel were normalized between MDCK II cells cultured on clear or translucent hanging 0.4 µm hanging well inserts for 7 days at 625, 2500, and 5000 cells/well. Good equivalation between groups was observed as most analytes fell between 80-120% of equal values (Clear/Translucent=1). Increased markers of proliferation (Cyclin B1 and Ki67) were observed in cells grown in clear inserts starting with 625 cells/well compared to translucent wells.

Figure 8.Median Fluorescence Intensity (MFI) readings using the MILLIPLEX® Cell Health Panel were normalized between MDCK II cells cultured on clear or translucent hanging 0.4 µm hanging well inserts for 7 days at 625, 2500, and 5000 cells/well. All culture conditions resulted in similar low expression profiles for selected markers of cells stress: CHOP (ER stress-Protein Secretion), NFkB (Inflammation), pH2A.x (Genotoxicity), HIF1-a (Oxidative Stress), p-p53 (DNA Damage), cleaved PARP (Apoptosis), and GRP78 (ER Stress).
Related Products
Para seguir leyendo, inicie sesión o cree una cuenta.
¿No tiene una cuenta?