


Research Area - Drug Discovery |
Request Information |
Featured Spotlights
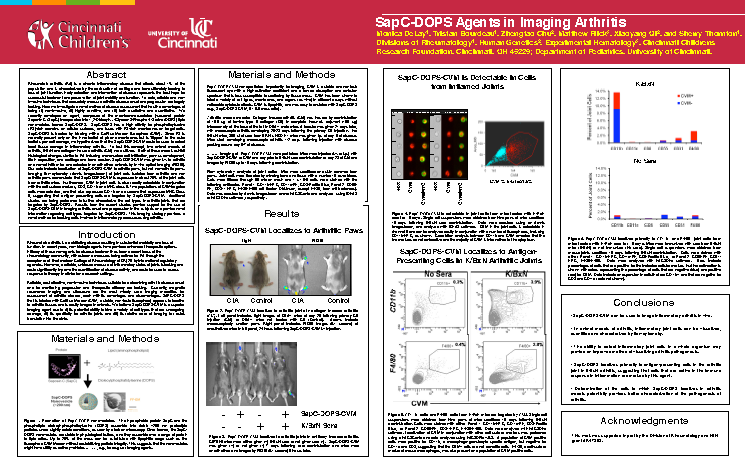
| Poster: SapC-DOPS Agents in Imaging Arthritis CYTO 2010 |
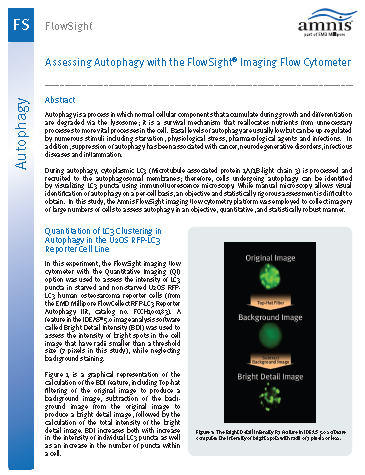
Technical Information: Assessing Autophagy with the FlowSight® Imaging Flow Cytometer |
|
|
|
|
|
|
 The goal of drug discovery is to find well-qualified candidate drugs expected to provide therapeutic benefit. Use of relevant and information-rich assays can rapidly eliminate candidates that either do not affect the appropriate response or cause some unforeseen lethality, and can save drug companies time and money that is often wasted pursuing clinical trials with flawed drug candidates. Many of the Amnis® imaging flow cytometry's applications are ideally suited for characterizing drug candidates, including cell signaling, cell-cell interactions, chemokine-induced shape change, cell death, co-localization, and phagocytosis, to name a few. Furthermore, these applications work with primary cells such as whole blood leukocytes and can often be multiplexed.
Co-Localization of an Antibody-Drug Conjugate to Endosomes or Lysosomes

Barcoding
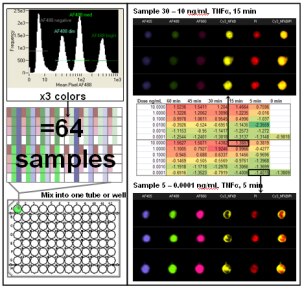
Here is an example of measuring the movement of NF-κB from the cytoplasm to the nucleus in response to varying doses and times of exposure to TNF-α. By labeling 64 separate samples with different combinations of 3 dyes (AlexaFluor 405, 488, and 660) at 4 intensity levels (43 = 64) it was possible to run one tube of the combined samples on the Imagestream®x and acquire a single file. After acquisition of over 600,000 images in 10-15 minutes, the color and intensity combinations of the samples were deconvoluted for further quantitative image analysis. Mean Similarity scores are reported in the spreadsheet and a heatmap has been applied. See the cell signaling application for more information about the translocation assay. The combination of high speed image acquisition and automated quantitative image analysis provided by the Imagestream®x system offers a major advancement in the field of drug discovery.