


Cell-Cell Interaction |
Request Information |
Featured Spotlights
| Poster: Human plasmacytoid dendritic cells and myeloid dendritic cells fuse with chronically HIV-infected T cells |
Technical Information: Measuring Immunological Synapse Using the FlowSight Imaging Flow Cytometer |
|

|

|
|
|
|
 Many biological responses are initiated through direct cell-cell interactions. Such interactions may result in the recruitment of signaling molecules to the interacting point of contact (such as at the immune synapse), or in transfer of materials between cells, or cellular fusion. These systems are naturally suited for microscopic analysis, and the high speed image acquisition and quantitative image analysis capabilities of Amnis® imaging flow cytometers bring major advances to the study of cell-cell interactions. Single cells, conjugates, and fusion events are easily distinguishable in statistically significant sample sizes, and accumulation of protein at the synapse or transfer of material between two cells readily identified and quantified.
- Ovalbumin Specific T Cells Incubated with Antigen Presenting Cells +/- Ovalbumin Peptide
- Membrane Transfer Between Cells
Featured Video
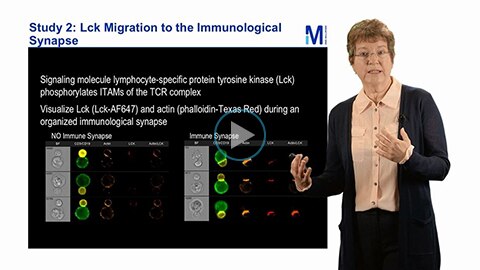
Watch to learn how multispectral imaging in flow can be used to answer specific cell interaction research questions. Dr. Sherree Friend explains how Amnis® applications use high-throughput imaging to characterize cell-cell interaction events. Using antigen presenting cells activated with enterotoxin B and incubated with T cells, microscopy in flow can be used to enhance analysis of the immune synapse.Click here to watch from tablet or mobile device.
Ovalbumin Specific T Cells Incubated with Antigen Presenting Cells +/- Ovalbumin Peptide

Membrane Transfer Between Cells
Browse our Amnis® Imaging Flow Cytometers portfolio