Cell Signaling Multiplex Assays: Uncover How Cells Communicate
Measure activation of cell signaling pathways using MILLIPLEX® bead-based multiplex assays. Multiplexing with cell signaling phosphoprotein assays based on Luminex® xMAP® technology helps researchers measure multiple phosphoproteins or total proteins within the same pathway or different pathways from a single sample. Read on to see how this can advance research on cancer, immunology/inflammation, toxicity, and more.
Benefits of Multiplexing Cell Signaling Pathways
Multiplexing provides faster answers to intracellular pathway questions compared to traditional Western blots, mass spectrometry, and radioactive phosphorylation assays that require large amounts of sample. For example, with MILLIPLEX® multiplex assays, based on Luminex® xMAP® technology, researchers get the gift of time and sample. Table 1 shows a comparison of MILLIPLEX® assays to Western blot assays.
MILLIPLEX® intracellular pathway multiplex kits and panels are analytically verified using the same stringent performance criteria used to manufacture our circulating biomarker kits, and they are optimized to yield maximum data from precious samples. Our cell signaling assays enable accurate relative quantitation of both total and phosphorylated forms of signaling proteins, revealing connections and crosstalk within your pathways of interest.
These analytically verified intracellular pathway assay kits offer:
- Stimulated and unstimulated cell lysates to qualify assay performance
- Premixed magnetic beads to capture analytes of interest
- Detection antibody cocktails designed to yield consistent analyte profiles within a panel
- Relative quantitative fold-increase data (Median Fluorescence Intensity, MFI)
How Cell Signaling Multiplex Assays Are Being Used in Research
Cell signaling multiplex assays help to compare phosphoprotein and total protein levels from a sample which gives insights into different signaling pathways including cancer, inflammation, and even the endocannabinoid system. Examples of intracellular pathways that are being analyzed with multiplex kits include:
- Akt/mTOR
- Apoptosis
- Bcl-2 Family
- DNA Damage/Genotoxicity
- MAPK/SAPK
- NFκB
Cell signaling assays are critical in cancer research because of the complex signaling pathways involved in tumor development and metastasis. Such assays are essential in drug discovery and in studies where understanding intricate signaling networks is key.
Below describes examples of how researchers are using MILLIPLEX® cell signaling multiplex assays.
Using a Cell Health Panel as a Screening Tool for Early-Stage Drug Discovery
Cellular health is central to biological function, disease progression, and therapeutic response. Monitoring cellular stress pathways is essential in drug development and toxicity screening. The MILLIPLEX® Human Cell Health Panel, built on Luminex® xMAP® technology, measures 16 biomarkers linked to apoptosis, necrosis, oxidative stress, and inflammation — enabling high-throughput, multiplexed screening with reduced sample needs and time. To demonstrate the utility of this cell health panel as a drug screening tool, HepG2 cells were used to evaluate test and control compounds at 24- and 48-hour post treatment time points. Control compounds were selected based on their known effects on the regulation of biomarkers involved in cellular function, as described in Table 2.
Test compounds, M1–M6, were chosen based on indications from previous studies. Cells were incubated with the following control and test compounds at the concentrations listed in Table 3.
To assess the effects of compounds, a cell viability assay was performed after each incubation period. Viability was evaluated by measuring cellular ATP content relative to DMSO control, with Tamoxifen Citrate (10 - 50 µM with a final DMSO concentration of 0.5%) used as a positive control for cytotoxicity. For samples designated for the Cell Health assay, the medium was removed from the wells, and 160 µL of lysis buffer containing protease inhibitors was added to each well. The plate was then incubated for 30 minutes at 4°C and stored at -80°C until further analysis. Sample plates were thawed at room temperature. Assay was conducted according to the protocol for MILLIPLEX® Human Cell Health Panel.
Overall, control compounds showed expected profiles with strong biomarker induction at 24 hours and reduced expression at 48 hours, except for cleaved PARP and GRP78, which remained elevated, confirming assay validity (Figure 1A). Among the test compounds, M1–M3 were the most active. M1 compound strongly induced apoptosis, with a >20-fold increase in cleaved PARP at 48 hours and sustained phospho-H3 and GRP78 (Figure 1B). The M2 compound initiated DNA damage (phospho-H2A.X) at 24 hours, progressing to apoptosis (cleaved PARP) and increased stress response (GRP78) at 48 hours (Figure 1C). M3 compound triggered broad stress responses (HIF-1α, phospho-p53, cleaved PARP, GRP78) that persisted over 48 hours (Figure 1D). For the remaining test compounds, M4 induced transient effects (Figure 1E), while M5 and M6 compounds were inactive on the samples tested (data not shown). Thus, M1–M3 compounds drive strong and sustained stress/apoptotic responses, whereas M4–M6 compounds have little to no activity.
Figure 1 visually summarizes the effect of control and test compound treatment on HepG2 cell protein expression after 24- and 48- hours. Heat map results detail the fold changes of protein expression of 16 biomarkers after treatment as compared to DMSO controls. The color scale ranges from low (dark purple) to high (orange/red), with higher values indicating increased protein expression levels. Values below the limit of detection (LOD) are marked with X.

Figure 1.Log2 fold changes of protein expression after 24- and 48-hours treatment, for control (A) M1 (B), M2 (C), M3 (D), and M4 (E) compounds. Heat maps for test compounds M5 and M6 are not shown.
These new results show the strength of the MILLIPLEX® Human Cell Health Panel to simultaneously detect 16 biomarkers for cellular function in a single well. This panel can support:
- Early-stage drug screening
- Mechanism-of-action studies
- Cytotoxicity profiling
- Rapid candidate prioritization
Its high-throughput, multiplex format provides a powerful tool for efficient, data-rich cell health assessment in drug discovery workflows.
Analysis of Bcl-2 Family Members and Protein-Protein Interactions
Bcl-2 family members play a very important role in intrinsic apoptotic pathways. The family consists of more than 17 members that can be functionally separated into pro-apoptotic and anti-apoptotic subfamilies. Interactions between these family members determine cell fate, and dysregulation can lead to tumor growth and tumor cell survival.
There are several investigational drugs for cancer treatment targeting Bcl-2 family members in clinical trials, driving the need for robust assays to measure Bcl-2 family members and their interactions. Though existing assays measure Bcl-2 family members, there is a lack of reliable assays to evaluate total proteins and protein-protein interactions simultaneously. To address this issue, two Luminex® technology-based multiplex immunoassay panels that allow for the simultaneous detection of multiple components of the Bcl-2 family in a single well, including Total Bcl-2, Bcl-xL, Mcl-1, BAD, BIM, and BAX, as well as protein interactions like Mcl-1/BIM, Bcl-xL/BAD, and NOXA/Mcl-1* (*data not shown) were developed.
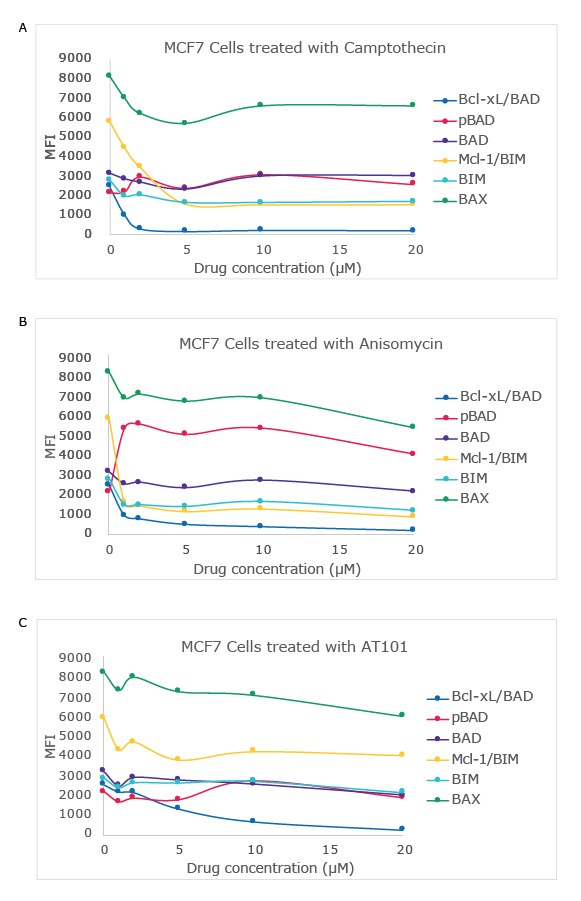
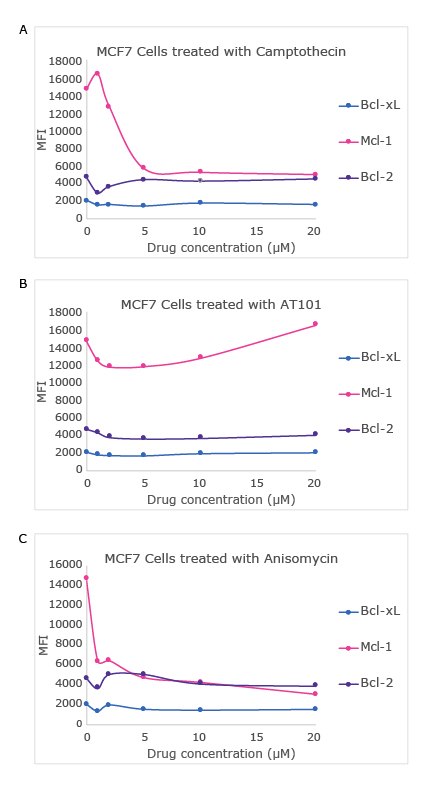
Using the MILLIPLEX® Bcl-2 Family Apoptosis Panel 1 and Panel 2, changes in the expression and interactions of Bcl-2 family members were analyzed in response to known apoptotic drugs, including camptothecin (topoisomerase inhibitor), anisomycin (protein translation inhibitor), and AT101 (BH3 mimetic drug). Camptothecin and anisomycin each elicited a significant decrease in the levels of Mcl-1 as well as a slight decrease in BIM levels. Additionally, the Mcl-1/BIM interaction was disrupted by both camptothecin and anisomycin probably due to reduced levels of both the proteins.
AT101, on the other hand, had no significant effect on either Mcl-1 levels or the Mcl-1/BIM interaction. In contrast to their disparate effects on the Mcl-1/BIM interaction, all three drugs acted similarly in blocking the Bcl-xL/BAD interaction without affecting the total levels of either protein. Figures 2 and 3 show data from the drug dose-dependent study in the MCF7 cell line using the MILLIPLEX® Bcl-2 Family Apoptosis Panel 1 and Panel 2 respectively.

Figure 2.Drug dose-dependent analysis was completed using MILLIPLEX® Bcl-2 Family Apoptosis Panel 1. MCF7 cells were treated with 0, 1, 2, 5, 10, and 20 μM concentrations of camptothecin, anisomycin, and AT101 for 16 hours. 20 μg total protein of each lysate diluted in MILLIPLEX® Assay Buffer 1 was analyzed according to the assay protocol (lysate incubation at 4°C overnight).

Figure 3. Drug dose-dependent analysis was completed using MILLIPLEX® Bcl-2 Family Apoptosis Panel 2. MCF7 cells were treated with 0, 1, 2, 5, 10, and 20 μM concentrations of camptothecin, anisomycin, and AT101 for 16 hours. 20 μg total protein of each lysate diluted in MILLIPLEX® Assay Buffer 1 was analyzed according to the assay protocol (lysate incubation at 4°C overnight). Note, data is not shown for the NOXA/Mcl-1 protein interaction.
Overall, these results illustrate the dynamic responses of the Bcl-2 family to apoptosis-inducing drugs. The novel MILLIPLEX® multiplex immunoassays described here provide a powerful tool for studying the underlying mechanisms regulating the Bcl-2 family of proteins.
Specific Detection of Mutant Ras Oncoproteins in Cell and Tissue Lysates
Ras proteins (HRAS, KRAS, and NRAS) are small GTPases that function as molecular switches by alternating between inactive GDP-bound and active GTP-bound states. Ras-GTP activates downstream pathways, including the MAPK pathway by binding to Raf kinase and phosphatidylinositol 3-kinase (PI3K) to promote cellular proliferation, survival, growth, and differentiation. Oncogenic mutations in Ras are found in approximately 25% of human cancers. Furthermore, 90% of pancreatic cancers harbor KRAS mutations with 80% of KRAS mutations occurring at codon 12 with Ras G12V and G12D being the most prevalent.
The Ras-Raf-MEK pathway can also be activated downstream of Ras. BRAF is a well-established oncogene, with the BRAF V600E mutation being prevalent in melanoma. While targeting this BRAF oncoprotein has had therapeutic efficacy, treating cancers driven by Ras oncoproteins remains an urgent unmet clinical need.
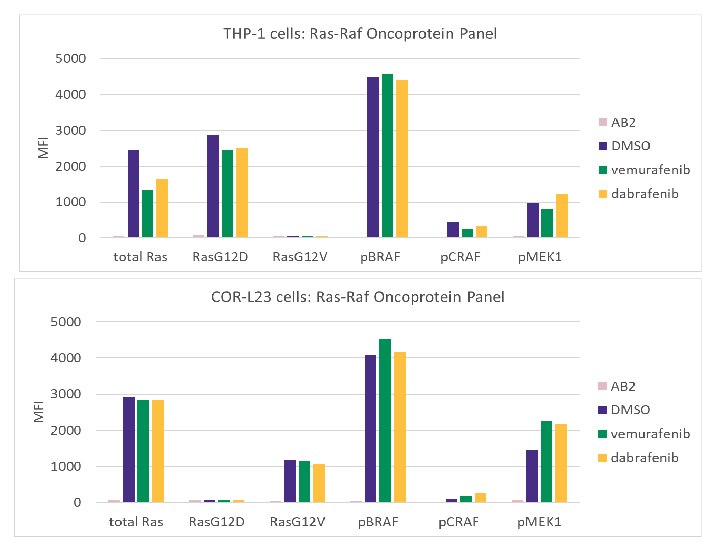
The MILLIPLEX® Ras-Raf Oncoprotein Magnetic Bead Panel was developed to simultaneously detect total Ras, Ras G12V, Ras G12D, phospho-MEK1 (S217/S221), phospho-BRAF (S446), and phospho-CRAF (S338) in a single well. This multiplex assay detects the H-Ras, N-Ras, and K-Ras isoforms for total Ras, RasG12D, and RasG12V. To confirm specific recognition of mutant Ras oncoproteins, this kit can detect the known KRAS G12V mutation found in the COR-L23 cell line and the NRAS G12D mutation found in the THP-1 cell line, respectively (Figure 4).

Figure 4.THP-1 cells and COR-L23 cells were treated with 2 μM vemurafenib or 125 nM dabrafenib for 72 hours before cells were harvested and cell lysates were analyzed using the MILLIPLEX® Ras-Raf Oncoprotein Panel. No effects of vemurafenib or dabrafenib were observed in these cell lines lacking BRAF mutation.
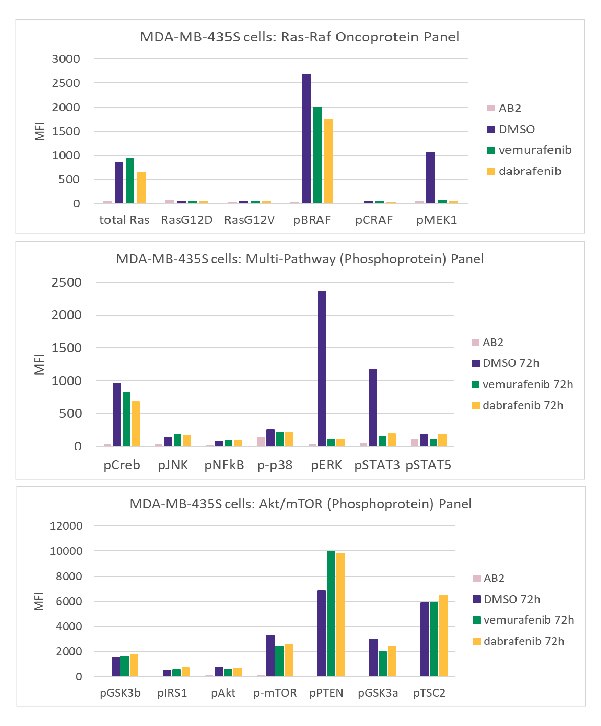
In addition, the response to the BRAF inhibitors, vemurafenib and dabrafenib, was compared between MDA-MB-435S cells, which harbor the BRAF V600E mutation, and insensitive cell lines, using multiplex immunoassays (Figure 5).

Figure 5.MDA-MB-435S cells bearing a BRAF V600E mutation were treated with 2 μM vemurafenib or 125 nM dabrafenib for 72 hours. Cells were harvested and lysates were analyzed using the MILLIPLEX® Multi-Pathway, Akt/mTOR (Phosphoprotein), and Ras-Raf Oncoprotein Panels.
Further, commercially-sourced tissue lysates were analyzed using tumor and adjacent tissue from a patient with colon cancer harboring a KRAS G12D mutation. Finally, exosomes were enriched from pancreatic cancer serum and tested using the Ras-Raf Oncoprotein Panel (data not shown). This data demonstrates the utility of studying the effects of Ras oncoproteins by MILLIPLEX® multiplex immunoassays in multiple sample types, including cell, tissue, and exosomal lysates.
Tips on Using MILLIPLEX® Cell Signaling Assays
Below describes some tips and tricks on using our MILLIPLEX® singleplex and multiplex cell signaling assays.
Using Cell Signaling MAPmate™ (Singleplex) Assays
- Plex loading control MAPmate™ assays into existing MILLIPLEX® Cell Signaling panels to enhance the panel within guidelines provided in the protocols.
- Our Cell Signaling Buffer and Detection Kit may be purchased if additional buffers are required.
- A flat-bottom plate is included for convenience.
“Plexing” Cell Signaling MAPmate™ Assays
- MAPmate™ assays can be added to existing cell signaling kits to serve as controls.
- Refer to the guidelines provided in the kit protocol.
- GAPDH and β-Tubulin MAPmate™ assays can be used for normalization with any of the MAPmate™ assays.
Preparation of Cell Lysates for Cell Signaling Assays in 96-Well Plates
- For adherent cell lines: seed ~40,000 cells/well and allow growth for 48 hours.
- For suspension cell lines: seed ~250,000 cells/well and collect at the desired time.
- For cell lysis: add 30 µL lysis buffer per well and pipette up and down thoroughly without creating too many bubbles. Request a more detailed protocol from Technical Support.
- Unbroken cells/parts can be cleared by either filtration or centrifugation.
- Lysis buffer can be found in the Cell Signaling Buffer and Detection Kit or it is sold separately.
- Add protease inhibitors (such as Protease Inhibitor Cocktail I; AEBSF) and/or phosphatase inhibitors to “home-brew” lysis buffers.
- Perform all dilutions with lysis buffer (not assay buffer or phosphate-buffered saline (PBS)).
Related Products
We offer three kit formats of MILLIPLEX® cell signaling assays to meet your diverse research needs.
Cell Signaling Phosphoprotein and Total Multiplex Premixed Assays
- Measure multiple phosphoproteins or total proteins within or across pathways in a single sample
- Get relative quantitative fold increase data from your multiplexed signaling assay kits
Cell Signaling Phosphoprotein + Total 2-Plex Assays
- Directly compare the phosphoprotein vs. total protein levels in your sample by reading them in the same well
- Combine with other phospho/total 2-plex assays to study phosphorylation and total expression of multiple proteins simultaneously
- Get relative quantitative fold-increase data from your multiplexed signaling assay kits
Singleplex MAPmate™ Loading Control Kits and Reagent Kits
- MAPmate™ analytes are housekeeping proteins that you can run with the existing MILLIPLEX® Cell Signaling Panels as loading controls
– Exception: panTyr detection-containing kits (such as the MILLIPLEX® RTK Phosphoprotein Magnetic Bead Panel and MILLIPLEX® T-Cell Receptor Signaling Magnetic Bead 7-Plex Kit) cannot be plexed with these loading controls - MAPmate™ kits are singleplex assays
- Each loading control MAPmate™ assay includes a capture antibody (bead-conjugated) and detection antibody (biotin-conjugated)
- Cell Signaling Buffer and Detection Kit may be purchased if additional buffers are required
– This contains the MILLIPLEX® lysis buffer, assay buffer, streptavidin-phycoerythrin, amplification buffer, unstimulated HeLa cell lysate, and a 96-well plate with 2 sealers
Note: To view analytes, phosphorylation sites, and species reactivity for each panel, download our Analyte Quarterly brochure . All kits are prefixed except the MILLIPLEX® RTK Phosphoprotein Magnetic Bead Panel which can be customized.
For Research Use Only. Not For Use In Diagnostic Procedures.
To continue reading please sign in or create an account.
Don't Have An Account?